SecurityRisk & complianceTrend
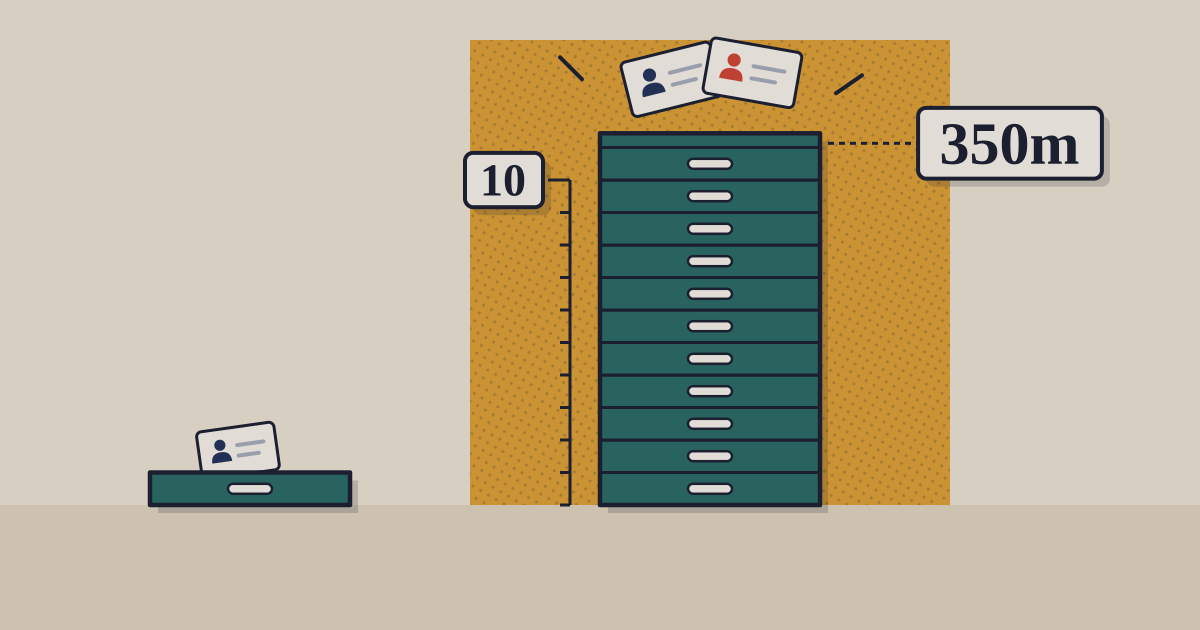
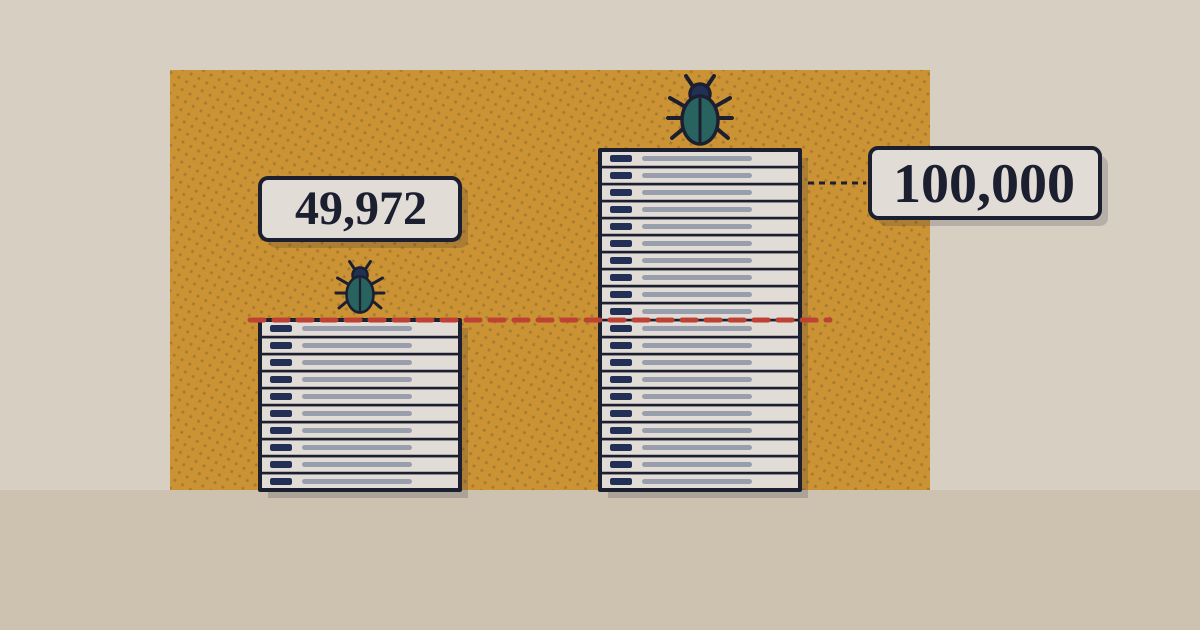
Published CVEs pass 100,000 this year, double last year’s 49,972
Our count of the US National Vulnerability Database to 14 November: 100,440 records, 17,481 of them in October, who numbers the flaws, and why exploited ones did not double.

A publicly disclosed software flaw usually gets a CVE number, and every scanner, patch report and compliance dashboard counts them. This year the count doubled. We counted the database most tools draw on, year by year from 2016 and month by month this year. What is being counted, who is adding to it, and does twice the number mean twice the risk?1
01From about 5,500 a month to 17,481
From January to April NVD added about 5,500 CVE records a month. The pace rose every month from May: 9,919 in July, 15,074 in September and 17,481 in October. The first fourteen days of November brought 8,121 more, which put the year at 100,440.1 The previous record was 2025’s 49,972.1
CVE records doubled in a year, the biggest jump since 2017
CVE records published in the National Vulnerability Database per year, 2016 to 2026 (2026 to 14 November)
Show tableHide table
| CVE records | |
|---|---|
| 2016 | 6,517 |
| 2017 | 18,113 |
| 2018 | 18,154 |
| 2019 | 18,938 |
| 2020 | 19,222 |
| 2021 | 21,950 |
| 2022 | 26,431 |
| 2023 | 30,949 |
| 2024 | 40,704 |
| 2025 | 49,972 |
| 2026 | 1,00,440 |
Source: NIST National Vulnerability Database, CVE API 2.0; TechBag count · as of 14 November 2026 · Includes records later rejected; the method box gives both counts
The doubling holds on the stricter count too. 2,772 of this year’s records have since been rejected, as duplicates or as not being flaws; the 97,668 that stand are about twice 2025’s 48,150 on the same basis. CVE.org, the programme’s own site, counts 48,244 records published in 2025.12 CVE.org’s quarterly table shows the same acceleration: 15,154 records in the first quarter, 20,696 in the second and 36,962 in the third.2
Monthly CVE records more than tripled between January and October
CVE records published in the National Vulnerability Database per month, January to October 2026
Show tableHide table
| CVE records | |
|---|---|
| Jan | 5,143 |
| Feb | 4,808 |
| Mar | 6,304 |
| Apr | 5,885 |
| May | 6,985 |
| Jun | 8,001 |
| Jul | 9,919 |
| Aug | 12,719 |
| Sep | 15,074 |
| Oct | 17,481 |
Source: NIST National Vulnerability Database, CVE API 2.0; TechBag count · as of 14 November 2026 · Includes records later rejected; 1 to 14 November: 8,121
02What a CVE record is, and who is writing more of them
A CVE record is one entry in a public list: one identifier for one flaw, with the affected product and versions, the kind of flaw and at least one public reference. It is written by a CVE Numbering Authority, or CNA: a software maker numbering flaws in its own products, a research firm, a bug-bounty platform or a national response team. A CNA first reserves an identifier while a flaw is being fixed, then publishes the record when it is ready to disclose.3 There are 567 CNAs in 43 countries; 86 joined this year. CNAs now write 95% of records themselves; the programme’s numbering authorities of last resort write the other 5%, against 50% in 2017.2
FIRST, the global body of incident-response teams, publishes a yearly forecast of CVE volume. Its mid-year update of 15 June found disclosures running 46.3% above its February forecast and named three drivers: AI-assisted discovery, a 449% year-on-year rise in GitHub Security Advisories, and a 3,119% rise in records from VulnCheck acting as a CNA of last resort, which takes on flaws no other CNA covers. It cites Mozilla, whose CVEs rose 164% in the first quarter, which FIRST attributes to AI-assisted tools run against the Firefox engine.5
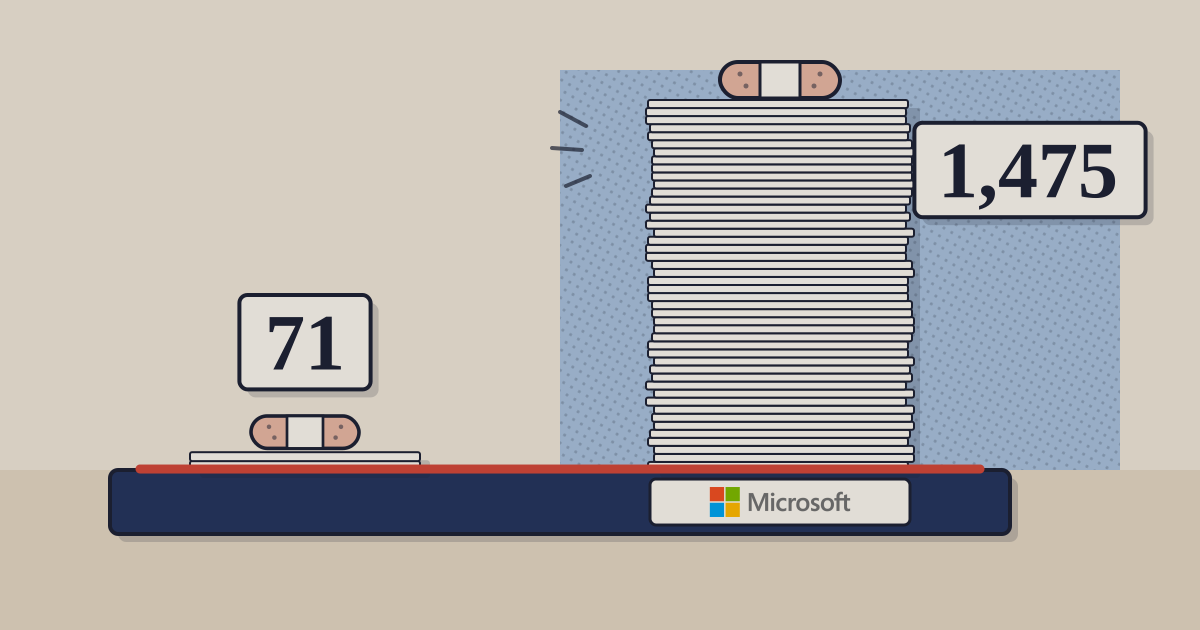
Josh Bressers, who leads coordinated disclosure at VulnCheck, told The Register that AI-driven bug hunting accounts for most of the volume, and named Microsoft, Oracle, GitHub and VulnCheck among the CNAs publishing in bulk.6 Microsoft’s own monthly releases went from 71 flaws a year ago to 1,475 in October and 1,095 in November, by our count of its update files.
03Twice the records, not twice the exploited flaws: what to watch
A CVE count measures how many flaws were found and written down, not how many are being used against anyone. VulnCheck says 1,363 of this year’s CVEs, about 1.4%, are in its catalogue of known exploited vulnerabilities.6 FIRST, filtering for real-world risk with CISA’s exploited-flaw catalogue and EPSS scores above 10%, says the patching burden “has not materially increased”.5 Our Microsoft count found the same: exploited flaws stayed between 0 and 6 a month while the total rose fifteenfold.
In 2026, the rain doesn’t stop. The job is no longer counting the drops. It’s knowing which ones will overrun the levee.
So the work is triage. FIRST’s advice is to use exploitability overlays, CISA’s catalogue and EPSS, rather than scale a team with the raw count.5 That depends on a current list of what software is actually installed, since a flaw in a product nobody runs needs no decision.
What to watch.
- The forecasts. FIRST’s February median for the year was 59,427, with a 90% range of 30,012 to 117,673; in June it raised it to about 66,000. The count has passed both, and the top of the range is about 17,000 away.45
- The pipeline. CNAs have reserved 105,782 identifiers this year, more than have been published; each reserved one can become a record.2
- CVE.org’s fourth-quarter table, published after the quarter ends, and its year-end reconciliation, which removes rejected records.2
Sources
- NIST National Vulnerability Database, CVE API 2.0 (counts by publish date, with and without noRejected) — queried 14 November 2026
- CVE Program, Metrics: published CVE records by quarter, reserved CVE IDs, CNA partners — as published on 14 November 2026
- CVE Program, Process: the CVE Record lifecycle — as published on 14 November 2026
- FIRST, Vulnerability forecast 2026: The Year Ahead — 11 February 2026
- FIRST, FIRST Mid-Year Vulnerability Forecast Confirms Historic Surge, Projects ~66,000 CVEs in 2026 — 15 June 2026
- The Register, This year’s bug count just passed 100K — 13 November 2026
Disclosure. TechBag is a software reseller: it earns when companies buy through it, including from vendors named here. The analysis is TechBag’s own; no vendor paid for or saw this piece before publication. Facts are labelled reported, TechBag count or our view.
Keep reading