Markets & the AI economyAnalysis
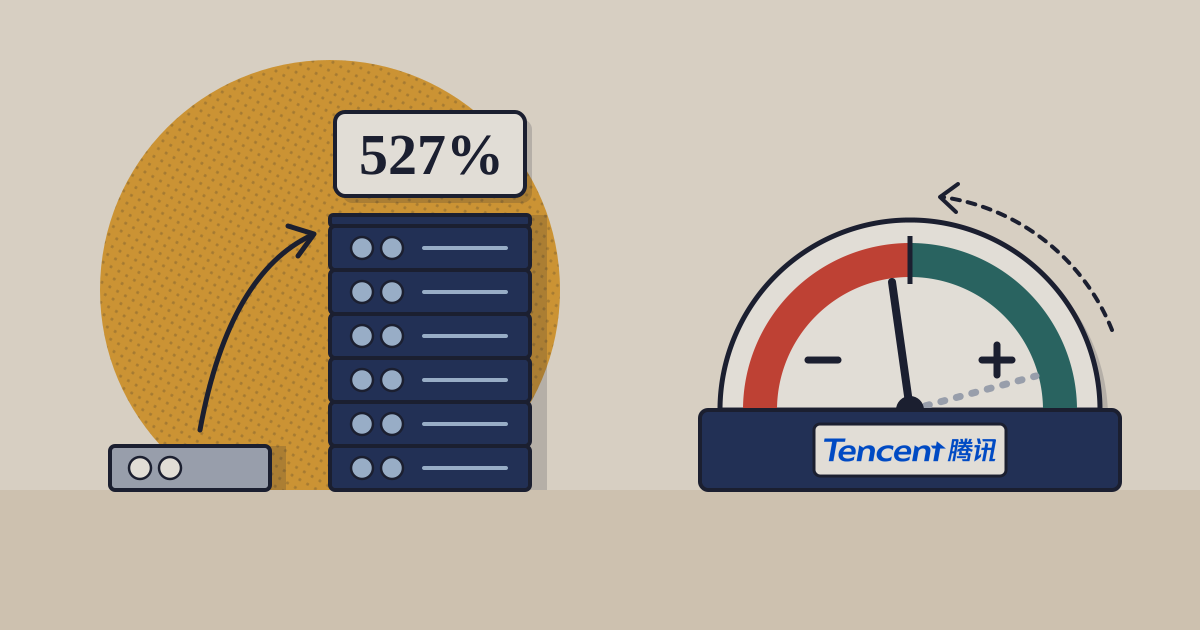
Tencent’s capex rose 527% to RMB81.4bn as its net cash turned to net debt
Tencent’s results for July to September: RMB81.4bn of capex, compute paid for in advance, what its new AI products cost in profit, and how net cash became net debt.

Tencent, the company behind Weixin and WeChat, Honour of Kings and a large cloud business, is now spending on AI faster than its businesses bring in cash. Its games and advertising grew. What changed this quarter is where the cash went and how it is being paid for. We read Tencent’s results announcement of 18 November and the six results announcements before it to answer three questions: how fast the spending grew, how Tencent is paying for it, and what its new AI products cost in profit.
01RMB81.4bn in a quarter, 39% of revenue
Tencent defines capital expenditure as investment in “IT infrastructure (including computer equipment, components, and software), data centres, land use rights, office premises and intellectual properties”, excluding media content. It was RMB81.4bn in the three months to 30 September, against RMB52.8bn in April–June and RMB13.0bn a year earlier. For the nine months, the figure was RMB166.2bn, against RMB59.6bn in the same period of 2025.12 The whole of 2025 came to RMB79.2bn.4
The line fell through most of 2025, from RMB36.6bn in October–December 2024 to RMB13.0bn in July–September 2025, and has risen in each of the four quarters since.467 At the Federal Reserve’s rate for 13 November, the latest quarter is about US$12.2bn.8 That is about a sixth of the US$77.3bn Amazon spent on property and equipment in the same quarter.9 Measured against its own revenue, Tencent spent RMB39 on capex for every RMB100 it took in, up from RMB7 a year earlier.1
Tencent spent 39% of its revenue on capex in July–September, up from 7% a year earlier
Capital expenditure per quarter (RMB bn) and as a share of that quarter's revenue (%), Q1 2024 to Q3 2026
- Capex (RMB bn)
- Capex as share of revenue (%)
Show tableHide table
| Capex (RMB bn) | Capex as share of revenue (%) | |
|---|---|---|
| Q1 24 | 14.4 | 9 |
| Q2 24 | 8.7 | 5.4 |
| Q3 24 | 17.1 | 10.2 |
| Q4 24 | 36.6 | 21.2 |
| Q1 25 | 27.5 | 15.3 |
| Q2 25 | 19.1 | 10.4 |
| Q3 25 | 13 | 6.7 |
| Q4 25 | 19.6 | 10.1 |
| Q1 26 | 31.9 | 16.3 |
| Q2 26 | 52.8 | 25.8 |
| Q3 26 | 81.4 | 39.3 |
Source: Tencent quarterly and annual results announcements, HKEX, May 2025 to November 2026 · as of 18 November 2026 · Capex as Tencent defines it, excluding media content; Q1 2024 to Q4 2024 from the prior-period columns of the 2025 announcements
Capex is what Tencent recorded as invested in the quarter. The cash it paid out for capex was lower, RMB65.1bn, and it is the cash figure that drives the next section.1 On the balance sheet, property, plant and equipment rose from RMB149.9bn at the end of 2025 to RMB242.5bn at 30 September.1
02Where the cash went: prepayments for compute
Tencent’s operations generated RMB2.6bn of cash in the quarter, against RMB85.3bn a year earlier. It explains why: “Included in our operating cash flow were significant prepayments for compute procurement to support enhancements to our Hy model family, WorkBuddy inference needs, and development of AI capabilities across our products and services, as well as to meet external demand for our cloud services.” After RMB65.1bn of capex payments, RMB4.6bn for media content and RMB2.0bn of lease payments, free cash flow was negative RMB69.1bn. Excluding the compute prepayments, Tencent says, it would have been positive RMB16.9bn.15
Compute prepayments turned the quarter's free cash flow from RMB16.9bn to minus RMB69.1bn
Tencent's cash flow, July–September 2026, RMB bn
- 01
About RMB88.6bn of operating cash
What operations brought in before the compute prepayments: the RMB2.6bn reported plus the prepayments inside it. - 02
About RMB86.0bn prepaid for compute
Paid in advance for computing capacity, which leaves RMB2.6bn of operating cash flow. - 03
RMB71.7bn of other outflows
RMB65.1bn of capex payments, RMB4.6bn for media content and RMB2.0bn of lease payments. - 04
Free cash flow: minus RMB69.1bn
Against plus RMB58.5bn a year earlier. Without the prepayments, plus RMB16.9bn.
Source: Tencent results announcement, 18 November 2026 (Liquidity and Financial Resources) · as of 18 November 2026 · Steps 1 and 2 are TechBag arithmetic from Tencent's two free cash flow figures
The prepayments show up as an asset. The non-current line “prepayments, deposits and other assets” stood at RMB162.9bn at 30 September, against RMB24.5bn at the end of 2025; Tencent does not split that line by purpose.1 The pattern is three quarters old. Free cash flow was RMB56.7bn in January–March, when operating cash was RMB101.4bn and capex payments RMB37.0bn. It turned negative in April–June, at RMB13.8bn, with RMB59.3bn of capex payments.32
03From RMB146.9bn of net cash to RMB13.7bn of net debt
Tencent measures net cash as cash, term deposits and highly liquid treasury investments, minus borrowings and notes payable. At 30 September that came to net debt of RMB13.7bn. Tencent puts the change since June down to “large compute procurement, partly offset by net cash inflows of RMB8.4 billion” from selling more investments than it bought.1 Three months earlier it had RMB58.2bn of net cash, after RMB59.3bn of capex payments and RMB41.6bn of dividends in April–June; at the end of March it had RMB146.9bn.23
Tencent went from RMB146.9bn of net cash to RMB13.7bn of net debt in six months
Net cash (positive) or net debt (negative) at each quarter end, RMB bn, December 2024 to September 2026
RMB bn
Show tableHide table
| Net cash | |
|---|---|
| Dec 24 | 76.8 |
| Mar 25 | 90.2 |
| Jun 25 | 74.6 |
| Sep 25 | 102.4 |
| Dec 25 | 107.1 |
| Mar 26 | 146.9 |
| Jun 26 | 58.2 |
| Sep 26 | -13.7 |
Source: Tencent quarterly and annual results announcements, HKEX, May 2025 to November 2026 · as of 18 November 2026 · Tencent's definition: cash, term deposits and treasury investments minus borrowings and notes payable; stakes in other companies are not counted
Most of the debt is bank loans. Borrowings stood at RMB380.1bn at 30 September, up from RMB298.9bn at 30 June and RMB251.0bn at the end of 2025; notes payable were RMB159.3bn. Most of its long-term yuan bank loans, RMB169.1bn, carry interest of 2.41% to 3.10% a year. Interest and related expenses were RMB3.7bn in the quarter, against RMB3.2bn a year earlier.1 In October Tencent sold more bonds: US$1.8bn of 10- and 20-year notes at 6.10% and 6.75%, swapped into yuan, and RMB26.0bn of 10- and 30-year notes at 2.40% and 3.00%.1
04What the new AI products cost in profit
Revenue rose 8% to RMB207.3bn. Operating profit fell 7% to RMB59.1bn under IFRS, and non-IFRS operating profit, Tencent’s own measure that leaves out share-based pay, amortisation from acquisitions and some other items, fell 6% to RMB68.1bn. The non-IFRS operating margin fell to 33% from 38%.1 Then comes the figure Tencent has given each quarter this year: “Non-IFRS operating profit, excluding new AI products’ contributions, increased by 8% year-on-year to RMB83.3 billion.” The new AI products, it says, “primarily consist of Hy, Yuanbao, CodeBuddy, WorkBuddy, and Xiaowei”, Hy being its model family; in May it described the measure as excluding their “revenues, costs and expenses”.13
RMB15.2bn
the gap between Tencent's non-IFRS operating profit with and without its new AI products, July–September
RMB68.1bn as reported, down 6%; RMB83.3bn without the new AI products, up 8%. The gap was RMB8.8bn in January–March and RMB10.5bn in April–June.
The costs show up in three places. General and administrative expenses rose 29% to RMB44.1bn, “primarily driven by higher R&D spending to improve our Hy model family, advance Weixin AI initiatives and develop AI capabilities across our products and services”; without R&D they were RMB11.7bn, up 2%. Selling and marketing rose 6% to RMB12.1bn on promotion of AI products including WorkBuddy. And the gross margin of Marketing Services fell to 52% from 57%, on “AI-related operating costs” and the content costs of its Mini Dramas service.1
Infrastructure running costs more than doubled in a year; R&D spending rose 42%
Selected expenses, RMB bn, July–September 2025 and July–September 2026
- Jul–Sep 2025
- Jul–Sep 2026
Show tableHide table
| Jul–Sep 2025 | Jul–Sep 2026 | Change | |
|---|---|---|---|
| Staff costs | 32.4 | 32.6 | 1% |
| R&D spending | 22.8 | 32.4 | 42% |
| Infrastructure running costs | 8.6 | 20 | 133% |
| Depreciation | 8.8 | 13.7 | 56% |
| Promotion and advertising | 8.6 | 8.7 | 1% |
Source: Tencent results announcement, 18 November 2026 (note 3, expenses by nature) · as of 18 November 2026 · R&D overlaps the other lines, and much of it is staff pay. Infrastructure running costs exclude depreciation
The headline profit held up for another reason. Profit attributable to shareholders rose 0.8% to RMB63.6bn, helped by RMB10.1bn of net gains from investments and other items, against RMB2.8bn a year earlier.1
05What the spending is for
Tencent says WorkBuddy “became the most used AI product in China, measured by large language model token consumption, with over 10 million DAU collectively consuming over 100 trillion tokens per day, and rapidly increasing enterprise adoption”. It released its Hy4 model in November. Cloud services revenue rose 35%, “underpinned by increased demand for AI-related services and continued international expansion”, and Tencent says it “allocated more compute to Model as a Service and GPU rental”.1
WorkBuddy has over 10 million daily users; cloud revenue rose 35% while ads rose 19%
Tencent's AI and growth measures, July–September 2026
10m+
WorkBuddy daily active users
Tencent
100tn+
tokens a day consumed by WorkBuddy users
Tencent
+35%
cloud services revenue, year on year
Tencent
+19%
Marketing Services (advertising) revenue, to RMB43.0bn
Tencent
Source: Tencent results announcement, 18 November 2026 · as of 18 November 2026 · DAU and token figures are Tencent's; it does not give cloud revenue in yuan
The businesses paying for it still grew. Domestic games revenue rose 11% to RMB47.6bn, Marketing Services 19% to RMB43.0bn and FinTech and Business Services 9% to RMB63.7bn; international games fell 9%, against a year-earlier quarter Tencent describes as a high base.1 Baidu, which reported two days earlier, showed the same shift: its AI Cloud Infra revenue rose 94%12 (see our Note on Baidu’s quarter). For the four largest US spenders, our quarterly capex line tracks the same build-out.
The figures to read in Tencent’s next announcement are capex, and free cash flow with and without the compute prepayments: without them, it has gone from RMB37.6bn in April–June to RMB16.9bn in July–September.21
Sources
- Tencent Holdings, Announcement of the results for the three and nine months ended 30 September 2026 (HKEX) — 18 November 2026, 16:30 HKT
- Tencent Holdings, Announcement of the results for the three and six months ended 30 June 2026 (HKEX) — 12 August 2026
- Tencent Holdings, Announcement of the results for the three months ended 31 March 2026 (HKEX) — 13 May 2026
- Tencent Holdings, Announcement of the annual results for the year ended 31 December 2025 (HKEX) — 18 March 2026
- Tencent Holdings, Announcement of the results for the three and nine months ended 30 September 2025 (HKEX) — 13 November 2025
- Tencent Holdings, Announcement of the results for the three and six months ended 30 June 2025 (HKEX) — 13 August 2025
- Tencent Holdings, Announcement of the results for the three months ended 31 March 2025 (HKEX) — 14 May 2025
- Federal Reserve, H.10 Foreign Exchange Rates (noon buying rates, 9–13 November 2026) — 16 November 2026
- The TechBag Journal, Big Tech's quarterly capex hit US$202bn, more than its operations brought in — 30 October 2026
- Press Information Bureau, Cabinet approves ambitious IndiaAI Mission to strengthen the AI innovation ecosystem — 7 March 2024
- Sarvam, Introducing Sarvam Token Factory — 16 November 2026
- Baidu, Baidu Announces Third Quarter 2026 Results — 16 November 2026
Disclosure. TechBag is a software reseller: it earns when companies buy through it, including from vendors named here. The analysis is TechBag’s own; no vendor paid for or saw this piece before publication. Facts are labelled reported, TechBag count or our view.
Keep reading