Nifty’s best week in five years: up 8.6% as FPIs bought and chip stocks fell 12%
NSE, NSDL and Nasdaq data for 2 to 6 November: the Nifty 50’s 8.58% week, foreign investors’ net equity buying, and the chip index’s second-worst day since 1999.

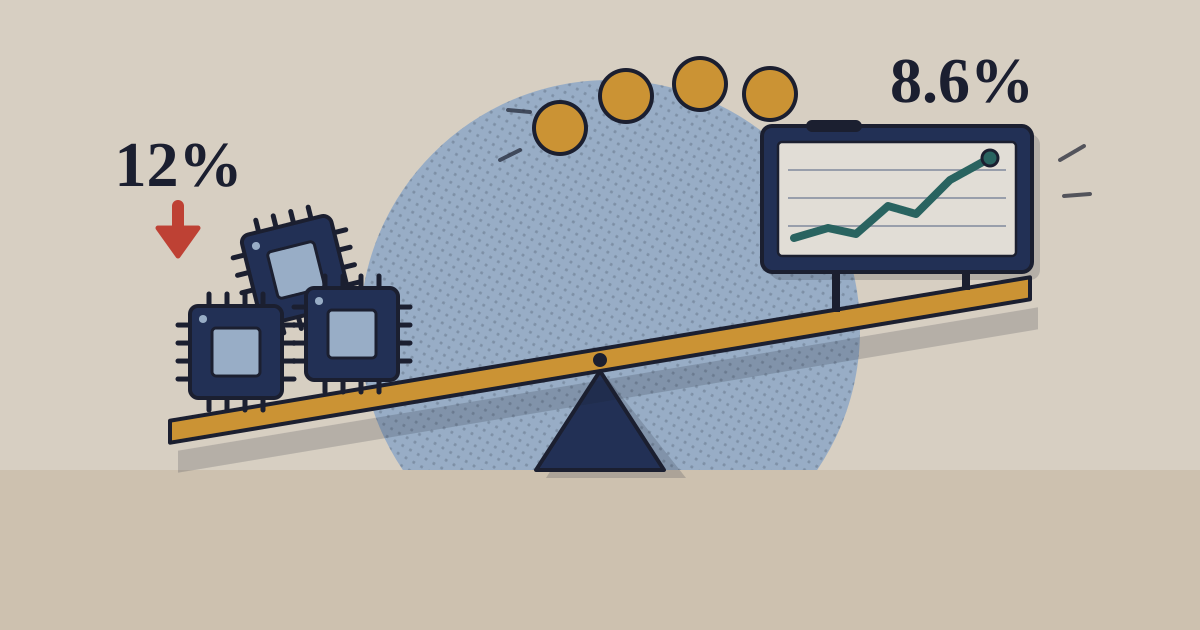
Two indexes went opposite ways in the same five days. India’s benchmark had its best week in more than five years while the index of US-listed chip companies had one of its worst, and foreign investors, net sellers of Indian shares in seven of the first ten months of 2026, bought on every reporting day. This piece sets the three series side by side from the exchanges’ and the depository’s own data, shows how to read the foreign-investor numbers, and separates what is measured from what is attributed.
01The line: India up, chips down
The Nifty 50 rose on all five days: 1.68% on Monday, then 1.58%, 0.63%, 2.40% and 2.01% on Friday.3 Measured Friday close to Friday close, only two weeks since 2020 were better: the week to 9 April 2020 (+12.7%) and the week to 5 February 2021 (+9.5%). The index is 12.6% above its 2026 low of 22,231.80 on 8 October and still 4.9% below its record close of 26,328.55 on 2 January.3
The Nifty 50 rose 8.6% in the week the chip index fell 12%
Daily close, indexed to 100 on Friday 30 October, 30 October to 6 November 2026
- Nifty 50
- Nifty IT
- PHLX Semiconductor (SOX)
Show tableHide table
| Nifty 50 | Nifty IT | PHLX Semiconductor (SOX) | |
|---|---|---|---|
| 30 Oct | 100 | 100 | 100 |
| 2 Nov | 101.7 | 99.5 | 96.6 |
| 3 Nov | 103.3 | 99.8 | 99.2 |
| 4 Nov | 103.9 | 98.3 | 96.1 |
| 5 Nov | 106.4 | 100.7 | 84.3 |
| 6 Nov | 108.6 | 101.1 | 87.9 |
Source: NSE daily index closing files; Nasdaq historical data (PHLX Semiconductor index); TechBag indexing · as of 6 November 2026 · Nifty IT shown muted for comparison
The PHLX Semiconductor index (SOX), which tracks US-listed chip designers, makers and equipment suppliers, had already fallen 7.2% on 30 October, before the week began. On Thursday 5 November it fell 12.25%, from 10,268.65 to 9,011.14. In Nasdaq’s data, which begin in January 1999, only 16 March 2020 (−15.9%) was worse. It rose 4.21% on Friday, ended the week 12.15% lower and closed 35.8% below its record of 14,634.72 on 22 June.7 The Nasdaq Composite fell 5.52% on Thursday and ended the week 10.9% below its 6 October record, past the 10% fall that markets call a correction.8 In Taipei the TAIEX fell 12.2% over the same week, as we reported on Friday.
India’s own technology index followed neither line. The Nifty IT rose 1.14% in the week to 32,977.90, still 28.3% below its record close of December 2024. Its large move came three weeks earlier: 11.7% in the week to 16 October, its best week since 2020.13
02The money: five days of buying after ten months of selling
NSDL, the depository that compiles foreign portfolio investors’ trades from their custodians’ reports, published net equity buying in every report of the week. Through the stock exchanges FPIs bought a net ₹38,519 crore, or US$4.07bn at the rates NSDL applies; with primary-market and other purchases, ₹38,971 crore.45 The largest single figure, ₹16,169 crore, was published on 6 November and covers trades of 5 November.5
Foreign investors' net buying grew through the week, to ₹16,169 crore in a day
FPI net investment in equity through the stock exchanges, ₹ crore, by trade date, NSDL reports of 2 to 6 November 2026
₹ crore
Show tableHide table
| Net equity buying | |
|---|---|
| 30 Oct | 4,319 |
| 2 Nov | 3,271 |
| 3 Nov | 6,899 |
| 4 Nov | 7,861 |
| 5 Nov | 16,169 |
Source: NSDL, Daily Trends in FPI Investments · as of 6 November 2026 · each NSDL report carries the previous trading day's trades; 6 November's trades appear on 9 November
The week reverses the year. By NSDL’s monthly table FPIs were net sellers of Indian equity in seven of the first ten months of 2026, ₹2,95,145 crore in all by our sum, including ₹1,17,775 crore in March and ₹34,843 crore in October. Their largest buying month was August, at ₹29,631 crore; November’s first five reports, at ₹38,971 crore, already exceed it.6 NSDL’s months run by reporting date, so 30 October’s trades count in November.
Money left Taiwan in the same days: foreign investors sold a net NT$524.38bn of shares on the Taiwan Stock Exchange in the week of 2 to 6 November, by the exchange’s figures.9 Neither data set shows whether the funds that sold in Taipei are the ones that bought in Mumbai.
03Why, by whose account, and what to watch
The chip fall. Yahoo Finance’s Jared Blikre wrote that after Democrats won control of both chambers of Congress “the focus shifted to what a Democratic Congress could mean for the AI build-out”, and that Thursday’s drop built on the 30 October sell-off, which had erased more than US$1tn of tech market value “over doubts about AI spending”.10
India’s rise. Upstox’s weekly wrap listed foreign buying, “a sharp correction in crude oil prices” (Brent down more than 16% in the week, to US$97.75 a barrel, by its figures), earnings, the US election result and “a potential near-term end to the escalations in West Asia”. It said foreign investors “appeared to favour markets offering relatively attractive valuations and growth potential”, and called it an emerging “anti-AI trade”.11 The argument predates the week: on 26 October V K Vijayakumar, chief investment strategist at Geojit Investments, told Business Today that “the weakening of the AI trade is positive for India” and that in September and October FPI selling in South Korea and Taiwan had been larger than the outflow from India.12
What to watch. NSDL’s report of Monday 9 November will carry Friday’s trades, the first day after the chip index’s fall.5 The Nifty needs another 5.2% to regain its 2 January record of 26,328.55.3 The SOX is 35.8% below its June peak.7 The coverage ties the two lines together; the next weeks of both series will show whether they keep moving in opposite directions, and NSDL’s monthly table whether November ends as 2026’s first large month of foreign buying.
Sources
- NSE, daily index closing values (ind_close_all), 6 November 2026 — 6 November 2026
- NSE, daily index closing values (ind_close_all), 30 October 2026 — 30 October 2026
- NSE, daily index closing files for every trading day, Nifty 50 and Nifty IT (historical index data) — 2 December 2019 to 6 November 2026 1,715 daily files; weekly changes, rankings and distances are TechBag arithmetic.
- NSDL, Daily Trends in FPI Investments, November 2026 (reporting dates 2 to 6 November) — 6 November 2026
- NSDL, Daily Trends in FPI Investments on 06-Nov-2026 (latest report) — 6 November 2026
- NSDL, Monthly FPI Net Investments, calendar year 2026 — up to 6 November 2026
- Nasdaq, PHLX Semiconductor index (SOX) historical data — January 1999 to 6 November 2026
- Nasdaq, Nasdaq Composite (COMP) historical data — 6 November 2026
- Taiwan Stock Exchange, trading value of foreign and other investors (BFI82U), week of 2 to 6 November — 6 November 2026
- Yahoo Finance, Jared Blikre: Chip stocks slaughtered as Wall Street suffers worst post-midterm day since 1896 — 5 November 2026 (US time)
- Upstox, Ahana Chatterjee: Market weekly wrap: SENSEX jumps 6,568 pts, NIFTY50 rallies 9% as FIIs return — 7 November 2026, 11:21 IST
- Business Today, Amit Mudgill: BT Explainer | AI trade unravels: Is Indian stock market set to gain? — 26 October 2026
Related on TechBag: Taiwan’s 12.2% week and Korea’s halt, the local data-centre ballots of 3 November and the IT & ITES industry guide.
Disclosure. TechBag is a software reseller: it earns a margin when a reader buys through it, including from vendors named here. The analysis is TechBag’s own; no vendor paid for or saw this piece before publication. Facts are labelled reported, TechBag count or our view.
Keep reading