The Trade Desk’s revenue fell 0.5%, ending 24 straight quarters of growth
The Trade Desk’s results and 10-Q for July to September: why its cut of client ad spend slipped, the one-off that softened it, and a floor of US$755m for the quarter ahead.

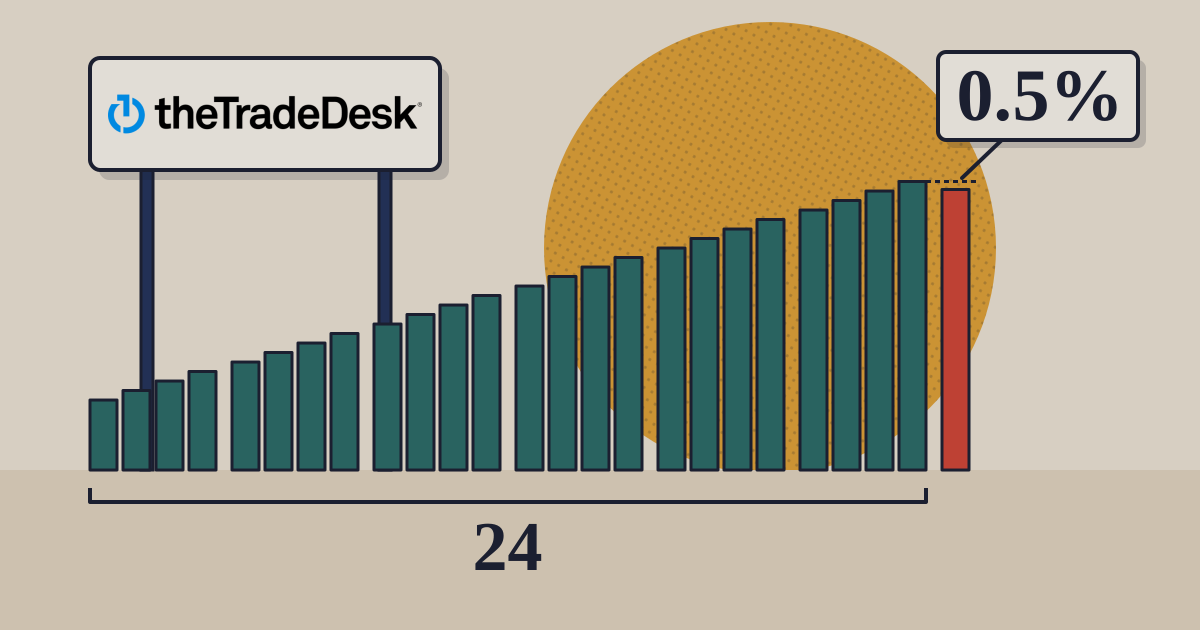
The Trade Desk, whose software lets agencies and brands buy digital advertising on connected TV, mobile and the open web, reported revenue of US$736.0m for July–September, down 0.5% from US$739.4m a year earlier.1 It is the company’s first year-on-year fall since April–June 2020, after 24 straight quarters of growth.3 Net income fell to US$38m from US$116m, and adjusted EBITDA, which excludes stock pay and restructuring charges, to 36% of revenue from 43%.1
After 24 quarters of growth, The Trade Desk’s revenue slipped below the year before
Quarterly revenue (US$ million) and change on a year earlier (%), April–June 2020 to July–September 2026
- Revenue (US$m)
- Change on a year earlier (%)
Show tableHide table
| Revenue (US$m) | Change on a year earlier (%) | |
|---|---|---|
| Q2 20 | 139.4 | -12.9 |
| Q3 20 | 216.1 | 31.6 |
| Q4 20 | 319.9 | 48.1 |
| Q1 21 | 219.8 | 36.8 |
| Q2 21 | 280 | 100.9 |
| Q3 21 | 301.1 | 39.3 |
| Q4 21 | 395.6 | 23.7 |
| Q1 22 | 315.3 | 43.5 |
| Q2 22 | 377 | 34.6 |
| Q3 22 | 394.8 | 31.1 |
| Q4 22 | 490.7 | 24 |
| Q1 23 | 382.8 | 21.4 |
| Q2 23 | 464.3 | 23.2 |
| Q3 23 | 493.3 | 24.9 |
| Q4 23 | 605.8 | 23.4 |
| Q1 24 | 491.3 | 28.3 |
| Q2 24 | 584.5 | 25.9 |
| Q3 24 | 628 | 27.3 |
| Q4 24 | 741 | 22.3 |
| Q1 25 | 616 | 25.4 |
| Q2 25 | 694 | 18.7 |
| Q3 25 | 739.4 | 17.7 |
| Q4 25 | 846.8 | 14.3 |
| Q1 26 | 688.9 | 11.8 |
| Q2 26 | 715.1 | 3 |
| Q3 26 | 736 | -0.5 |
Source: The Trade Desk 10-Qs and 10-Ks (SEC XBRL company facts) · as of 9 November 2026 · Growth is TechBag arithmetic on reported revenue; each October–December quarter is the full year less nine months
01What the 0.5% leaves out
The company earns a platform fee, generally a percentage of what clients spend through it, and reports revenue net of what it pays suppliers for advertising space.2 Its revenue is a slice of other people’s budgets. The 10-Q says the quarter’s fall was “primarily due to an overall decrease in gross spend on our platform driven by lower gross spend from existing clients”, partly offset by new clients, and that lower use of some data products and larger discounts on joint business plans, its longer-term deals with big agencies and brands, also cut revenue. It gives no figure for gross spend.2 On the call, chief financial officer Nate Olmstead named consumer goods and autos as the verticals under pressure.4
Three things held the reported number up:
- A one-off. The 10-Q counts US$15m of revenue from a strategic partner “that we do not expect to recur”.2 Olmstead put the benefit at “approximately 3 percentage points”.4
- A change in where a cost sits. Olmstead said “certain costs that historically were recognized as a reduction to revenue are now being recognized as a cost within platform operations expense”.4 That lifts revenue and expense alike. The filing does not size it; supplier-provided components in platform operations rose US$13m.2
- An election. Political advertising for the US midterms was “a mid-single-digit percentage of our business” in the quarter.4
02A floor of US$755m for the quarter ahead
For October–December The Trade Desk guides to revenue of at least US$755m, 10.8% below the US$846.8m of a year earlier.13 Its floors have been loose in both directions: it reported US$736m against a floor of US$650m for the latest quarter, and US$715m against US$750m for the one before.56 Revenue rose 14.5% from the September to the December quarter in 2025 and 18.0% in 2024; this floor implies 2.6%. “We’re not expecting the normal seasonal uplift Q3 to Q4,” Olmstead said, adding that political spending should be a little higher in the fourth quarter and that first-quarter revenue in election years has historically dropped about 25% from the fourth.4
The company cut about 15% of its workforce in September, booked about US$44m of restructuring charges and expects more than US$100m of gross savings in 2027.24 Its board added US$731m to the share buyback, making US$1bn available; it bought no shares in the quarter and held about US$1.6bn of cash and short-term investments.14
The results reached the SEC at 4:09pm New York time on 9 November, after the close, so that day’s move came before the numbers.1 The shares closed at US$14.93, up 15.5%, on 99.8m shares traded against 14.4m the session before; at that price the US$1bn buyback is about 14% of the company’s value, on 472.9m shares at 30 September.72 They were about 7% lower in premarket trading around 9am New York time on 10 November, the first session after the results.8 We found no company statement on the rise. What to watch: gross spend from existing clients in the annual report, and whether the December quarter clears a floor set about US$92m below last year.
Sources
- The Trade Desk, Reports Third Quarter 2026 Financial Results (8-K, Exhibit 99.1; accepted by the SEC at 4:09pm New York time) — 9 November 2026
- The Trade Desk, quarterly report on Form 10-Q, quarter to 30 September 2026 — 9 November 2026
- The Trade Desk, XBRL company facts on SEC EDGAR (revenue by period, 10-Qs and 10-Ks to 9 November 2026) — 9 November 2026
- The Motley Fool, The Trade Desk (TTD) Q3 2026 earnings call transcript (Jeff Green, Nate Olmstead) — 9 November 2026 call of 9 November; transcript posted 10 November
- The Trade Desk, second quarter 2026 results (8-K, Exhibit 99.1) — 6 August 2026
- The Trade Desk, first quarter 2026 results (8-K, Exhibit 99.1) — 7 May 2026
- Nasdaq, The Trade Desk (TTD) historical prices (closes and volume to 9 November 2026) — 9 November 2026
- StockAnalysis, The Trade Desk (TTD) quote, premarket about 9am New York time, 10 November — 10 November 2026
Disclosure. TechBag is a software reseller: it earns a margin when a reader buys through it, including from vendors named here. The analysis is TechBag’s own; no vendor paid for or saw this piece before publication. Facts are labelled reported, TechBag count or our view.
Keep reading